Westpac and the Melbourne Institute released their monthly consumer sentiment index for February 2016 earlier this week.
The index was recorded at 99.6 points which was slightly lower than the neutral setting of 100 points, indicating consumers are slightly more pessimistic than they are optimistic.
Over the month, consumer sentiment increased by 2.3% and is at its highest level in three months.
Looking at the components of the Index, respondents were more optimistic than pessimistic about their family finances over the next year and it being a good time to buy major household items.
Respondents were more pessimistic about family finances over the past year, economic conditions over then next year and the next five years.
Earlier this week the Australian Bureau of Statistics (ABS) released data on overseas arrivals and departures for December 2016.
The data showed that over the 2016 calendar year there was a record-high 18,936,800 arrivals to Australia which was 8.2% higher over the year.
At the same time as total arrivals increased, total departures were slightly lower at 18,724,800 having increased at a slower rate of 7.6% over the year.
There were 8,241,200 short-term arrivals to Australia over the year which was a record high and 10.6% higher over the year.
Short-term arrivals recorded a greater increase than departures which rose 4.4% however, a greater number of people departed Australia short-term than those that arrived with 9,869,900 short-term departures.
Overall it is positive to see arrivals to Australia growing more rapidly than departures which is ultimately positive for the Australian tourism sector.
Lending finance data for December 2016 was released by the ABS and when paired with housing finance data it provides insight into mortgage lending across each state and territory.
The most interesting trend from the data is the continued dominance of mortgage lending into NSW and Vic.
In December 2016, these two states accounted for a record-high 69.5% of all mortgage lending (NSW 41.8% and Vic 27.7%) and also a record-high 76.3% of investor mortgage lending (NSW 49.6% and Vic 26.7%).
NSW and Vic are a proxy for demand in Sydney and Melbourne and after more than 4.5 years of strong value growth, demand for mortgages is increasingly being focussed on Sydney and Melbourne
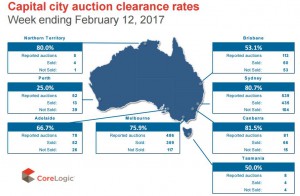
CoreLogic collected results for 85.3% of the capital city auctions held over the past week.
Based on these results, the combined capital city auction clearance rate was recorded at 73.2% across 1,591 auctions.
Clearance rates were higher over the week from the 68.8% clearance across 881 auctions the previous week.
Melbourne’s auction clearance rate fell from 77.7% to 75.9% last week with auction volumes increasing to 556 from 261 the previous week.
The Sydney auction clearance rate rose to 80.7% across 640 auctions last week from 72.3% across 259 auctions the previous week.
The combined capital cities as well as Sydney and Melbourne recorded higher auction clearance rates last week than they did at the same time 12 months ago.
Auction volumes are set to increase further this week with 2,136 capital city auctions currently scheduled.
Note that sales listings are based on a rolling 28 day count of unique properties that have been advertised for sale.
Over the 28 days to 12 February 2017 there were 45,292 newly advertised residential properties for sale nationally and 28,281 for sale across the combined capital cities.
Newly advertised properties for sale are continuing to climb each week however, they are -2.7% lower than they were a year ago nationally and -1.4% lower across the combined capital cities.
Sydney (+1.0%) and Canberra (+17.2%) are the only capital cities where the number of new properties available for sale is higher than at the same time last year.
Over the same four week period there were 225,455 properties advertised for sale nationally which was -7.6% fewer than at the same time the previous year.
Across the combined capital cities there were 99,574 properties available for sale which was -3.6% lower than at the same time in 2016.
The total number of properties advertised for sale was higher over the year in Brisbane (+5.3%), Adelaide (+0.7%) and Perth (+3.6%) bit lower across all other capital cities.
from Property UpdateProperty Update http://propertyupdate.com.au/the-week-that-was-in-property-50/


No comments:
Post a Comment