The capital city residential property markets have started the year strongly.
Prices across our five capital cities notched up some further gains this month, in what is traditionally a quiet time for our property markets .
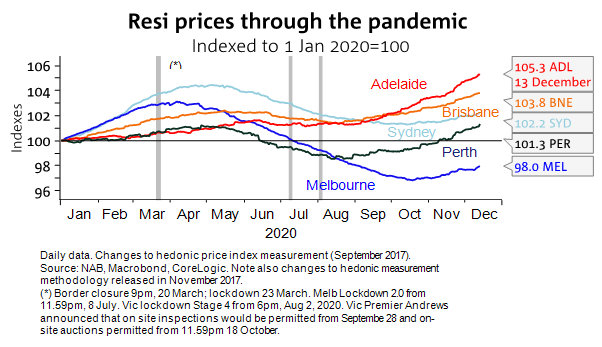
The following chart from CoreLogic shows that all property markets other than Melbourne are higher than they were 12 months ago, and Melbourne has made up most of its lost ground and is likely to reach new heights again shortly.

The following chart shows the cyclical nature of our property markets

Melbourne property prices are up 1.32% over the last quarter and are on track to start 2021 strongly as market activity and confidence continues to return.
At their measured low point in mid-October during the lockdown, prices were down almost 6% on pre-pandemic levels and over 3% year to date then.
Prices also rose in Sydney over 2020, up another 1.22% in the last quarter and Sydney’s median property value has risen 2.9% for the year.
While Melbourne prices have been understandably volatile this year and Sydney saw prices cool off after mid-year, prices in Adelaide and Brisbane have been more resilient, though did exhibit some signs of flattening in the September quarter. Adelaide prices have risen 5.7% this year, Brisbane prices by 4.5%.
After a soft start, the Perth market increasingly found its feet as 2020 progressed, prices up a net 1.4%, all of that coming in the second half of the year.
Buyers are back in droves around the country but…
The number of properties for sale in Australia is beginning to dry up.
Currently property buyers are heading back into our housing markets in droves, keen to get a foothold before property values surge.
But they are finding limited stock, with 7 of our 8 capital cities having significantly less properties for sale than 12 months ago.
Strong demand at a time of limited supply must lead to property price growth.

There are now a range of indicators suggesting our property markets are only going perform strongly in 2021.
- Consumer confidence has been consistently improving as has business confidence
- Auction clearance rates have been consistently strong in the last quarter of 202, not just in the two big auction capital of Melbourne and Sydney but around Australia
- More buyers and sellers are in the market and transaction numbers have increased consistently.
- At the same time the banks are keen to write new business – another positive for our housing markets.
- Bank loan deferrals have been consistently falling – there’s little likelihood of an avalanche of forced mortgagee sales creating the fical cliff some commentators were worried about.
- Historically low interest rates and the “guarantee” of rates remaining low for at least 3 years, will give home buyers and investors confidence
- Strong jobs creation, rising consumer confidence and improving business confidence (leading to spending and employment) will underpin our housing markets.
Clearly, our housing markets were not immune to the Coronavirus economic fallout, but those house price predictions of significant falls did not eventuate and now all credible economists have forecast significant house price growth in 2021 and 2022
These graphics show how all our major capitals have median values higher than at the beginning of the year – we’ve passed the bottom of this cycle.
To help keep you up-to-date with all that’s happening in property, here is my updated weekly analysis of data and charts as of December 44th provided by Corelogic and realestate.com.au.
Early Market Indicators
Let’s start with the number of indicators that could give us a clue to what’s ahead.
- Despite demand fading as we near Christmas, the year-on-year spike in buyer activity is the highest on record, as shown by realestate.com.au’s Weekly Demand Report.
The REA Insights Weekly Demand Index, which measures high-intent buyer activity on realestate.com.au, declined by -11.1 per cent last week.

Cameron Kusher Executive Manager, Economic Research, reports that Demand for houses slipped -11.0 per cent, which unit demand declined -11.2 per cent.
“All states recorded a fall in demand over the past week with the smallest falls in Tasmania (-5.2%) and Northern Territory (-5.3%) and the largest in Australian Capital Territory (-16.5%) and New South Wales (-13.5%).
As at the end of last week, demand had fallen by -29.3 per cent from its historic peak.
However, relative to the same time last year buyer demand is currently 51.8 per cent higher nationally – the largest year-on-year increase on record.
Both houses and units have seen record increases in demand year-on-year, up 51.2 per cent and 54.4 per cent respectively.
The largest year-on-year increases in demand have been recorded in Victoria (71.8%) and New South Wales (54.4%), while the smallest rises have been recorded in Tasmania (17.8%) and Western Australia (30.2%).
I would expect in early January 2021 we will see demand once again trending higher, spurred on by a large volume of active buyers in the market being driven by the lowest borrowing costs on record.
Next year is shaping up, at least initially, as a market in which demand will be very strong, with the major challenge a potential lack of vendors willing to list their properties for sale” said Kusher.
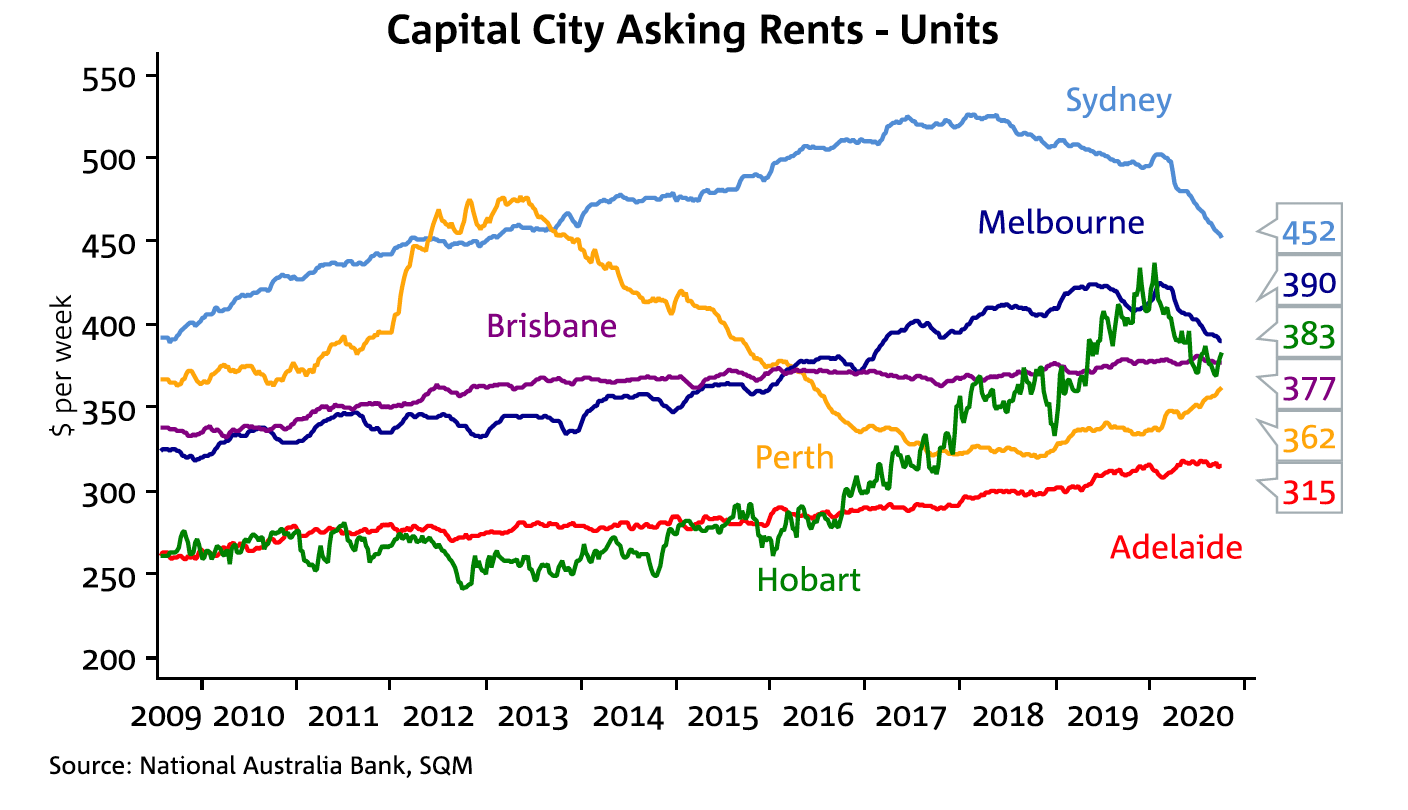
2. Rental markets.
Realestate.com.au reported that despite the Christmas break looming, rental demand on realestate.com.au increased for the second consecutive week last week.
The REA Insights Weekly Rental Demand Index, following a 1.5 per cent increase the week before last, there was a further 0.1 per cent rise in rental demand nationally last week.

Cameron Kusher Executive Manager, Economic Research explained that demand for rental houses was -0.2 per cent lower over the past week, though demand for rental units climbed by 0.3 per cent.
“Only New South Wales (-1.1%), South Australia (-1.5%) and Australian Capital Territory (-0.5%) recorded declines in rental demand last week, with Northern Territory (1.7%) and Queensland (1.5%) recording the largest increases.
Despite some recent increases, rental demand remains -24.2 per cent lower than its historic peak.
However, rental demand is up 23.3 per cent when compared to the same week last year.
Compared to last year, demand for rental houses is up 13.4 per cent, while demand for rental units has experienced a much larger increase, up 34.6 per cent.
Western Australia is the only state in which rental demand is lower than a year ago (-6.5%).
This is likely due to the fact that lending to first home buyers in Western Australia is at an historic high, more than doubling over the past 12 months.
Australian Capital Territory (38.4%) and Victoria (35.7%) have recorded the largest year-on-year increases in rental demand.
Rental demand typically rises early in January after falling through November and December, but things are playing out differently this year.
While the rises have been quite small to-date, it seems that some are getting a head start before the new year.
Early 2021 will be the litmus test for the rental market, with many leases expiring and no new foreign students arriving.
While demand is likely to be strong as people monitor the market conditions closely, what will be much more interesting is how much of an adjustment to rental prices occur as renters will undoubtedly be looking for cheaper rent or better rental accommodation.
It should be noted that we expect these adjustments to be much more prevalent in inner-city areas of major capital cities and for units as opposed to houses
It will definitely be something to closely monitor in early 2021″ said Kusher.

What’s happening to property prices?
There has been a palpable change in property market sentiment over the last few months.
But there is a flight to quality.
The shortage of A-grade homes and investment properties compared to the number of buyers out looking for them mean that property values in certain locations are steadily creeping up.
On the other hand B grade (secondary) properties are selling at a discount and no one really wants C grade properties.
The following charts were updated by Corelogic on January 18th, 2021.


Properties listed for sale

At a time when as buyers are returning to the market as confidence rises, the overall number of properties listed for sale is down 13.7% over the last year.
This lack of good properties for sale at a time when many interested buyers have returned to the market is one of the reasons property prices have, in general, held up well.
This confirms what we are finding on the ground Metropole that well-located properties are selling quickly with a queue of buyers waiting for them.


The number of property transactions
The following table of private treaty sales (which represents the vast majority of all dwelling sales across the country shows that over the last month before Christmas:
- In Melbourne, 1,156 houses (last month 2,125) and 775 apartments or units were sold (last month 992).
- In Sydney, 1,161 houses (1,901 last month) and 595 apartments were sold (1,101 last month).
- In Brisbane, 850 houses (1,222 last month) and 231 apartments were sold (298 last month).

NOW READ: Why Bluechip property will rebound strongly in 2021
Our Rental Markets
The COVID-19 pandemic has been an unprecedented shock to the rental housing market, reducing demand for rental properties at the same time as supply has increased.
Households most affected by the economic impact are more likely to be renters, and border closures have reduced international arrivals.
The number of vacant rental properties has increased as new dwellings have been completed and some landlords have offered short-term rentals on the long-term market, particularly in inner Sydney and Melbourne.
Government policies have supported renters and landlords.
Rents have declined, partly because of discounts on existing rental agreements and it is likely that rent growth in many areas will remain subdued for some time moving forward.
The absence of new and returning international students and the closing of international borders has dented rental property market, particularly in Sydney and Melbourne.

Vendor Metrics
Other than in Darwin, vendor metrics have suggested we’re moving into a seller’s market with the number of days to sell a property decreasing (a sign of the tight supply situation), and vendor discounting ( it’s easier for them to sell) at realistic levels.
The shortage of good properties on the market is seeing properties selling quickly with minimal discounting.

Auction clearance rates
Sydney
Auction clearance rates finished the year very strongly in Sydney.
At these levels, when around 80% of properties put to auction sell under the hammer three weeks in a row, price growth tends to follow.
There are now firm signs that we’ve passed the bottom of the Sydney property market.

And Sydney property sales remain strong, even though they’ve tapered off a little in the week leading into Christmas as would be expected.

Melbourne
As life in Melbourne gets back to normal, more properties are being listed for sale and auction clearance rates finished the year strongly despite 864 properties being taken to auction, showing the depth of buyer interest.

Melbourne property sales have continued to be strong, reflecting pent-up demand.
This situation is likely to continue as Melburnians get back to a more normal life and their confidence increases.

Brisbane
The Brisbane property market is performing very strongly with the number of sales being significantly higher than pre the Coronavirus pandemic. Brisbane will start the new year with a surge of pent up demand for home buyers and investors.

Here are the long term auction clearance trends


Now is the time to take action and set yourself for the opportunities that will present themselves as the market moves on in 2021

If you’re wondering what will happen to property in 2021 you are not alone.
You can trust the team at Metropole to provide you with direction, guidance and results.
In challenging times like we are currently experiencing you need an advisor who takes a holistic approach to your wealth creation and that’s what you exactly what you get from the multi award winning team at Metropole.
Why not get the independent team of property strategists and buyers’ agents at Metropole to help level the playing field for you?
We help our clients grow, protect and pass on their wealth through a range of services including:
- Strategic property advice. – Allow us to build a Strategic Property Plan for you and your family. Planning is bringing the future into the present so you can do something about it now! Click here to learn more
- Buyer’s agency – As Australia’s most trusted buyers’ agents we’ve been involved in over $3Billion worth of transactions creating wealth for our clients and we can do the same for you. Our on the ground teams in Melbourne, Sydney and Brisbane bring you years of experience and perspective – that’s something money just can’t buy. We’ll help you find your next home or an investment grade property. Click here to learn how we can help you.
- Wealth Advisory – We can provide you with strategic tailored financial planning and wealth advice. Click here to learn more about we can help you.
- Property Management – Our stress free property management services help you maximise your property returns. Click here to find out why our clients enjoy a vacancy rate considerably below the market average, our tenants stay an average of 3 years and our properties lease 10 days faster than the market average.
Remember the multi award winning team of property investment strategists at Metropole have no properties to sell, so their advice is unbiased.
Whether you are a beginner or a seasoned property investor, we would love to help you formulate an investment strategy or do a review of your existing portfolio, and help you take your property investment to the next level.
Please click here to organise a time for a chat. Or call us on 1300 METROPOLE.
Source of graphs and data: CoreLogic.
The capital city residential property markets are finishing the year strongly.
Prices across our five capital cities notched up some further gains this week. 
Similarly auction clearance rates ended the year solidly despite looming concerns about Covid 19 resurfacing.
These are all sign of the strength and depth of our property markets.
auction volumes rose this week in Sydney and Melbourne and auction results were strong around the country.
Melbourne property prices are up 0.3% so far this month, on track to record another month of gains as market activity and confidence continues to return.
At their measured low point in mid-October during the lockdown, prices were down as much as 6% on pre-pandemic levels and over 3% year to date then.
Melbourne’s median property value is likely finish the year down a little less than 2%.
Prices also rose in Sydney, up another 0.2% so far in December. With only a fortnight to go Sydney’s median property value has so far risen 2.2% for the year.
While Melbourne prices have been understandably volatile this year and Sydney saw prices cool off after mid-year, prices in Adelaide and Brisbane have been more resilient though did exhibit some signs of flattening in the September quarter. Adelaide prices have risen 5¾% this year, Brisbane prices by 4¼%.
After a soft start, the Perth market increasingly found its feet as the year progressed, prices up a net 1¼%, all of that coming in the second half of the year.
Buyers are back in droves around the country and currently Metropole’s buyers agent team are finding off-market deals are flourishing, particularly for sellers keen to finalise a deal before the traditional Christmas-New Year break.
This weekend Sydney and Melbourne’s weekend auction sales exceeded last year’s.
According to CoreLogic, the weekend’s preliminary national clearance rate was 73.6%, with Melbourne auction volumes up 25.8% this week, but that’s still down markedly on 1,405 for the same week last year.
This week’s heat map (see below) shows that over the week Australian property prices nudged a fraction higher.
Median prices are higher than they were 12 months ago in every city other than Melbourne (no surprise there) but there are still certain segments of the market that are going to suffer – the inner city apartment sales and rentals.
- Overall Sydney house prices rose 0.2% week and are up 3.3% over the last year
- Melbourne house prices rose 0.3% last weekend despite all the lockdowns will finish the year less than 2% down
- Brisbane house prices are up 0.2 last week, 0.8% over the last month, and 4.2% over the last year
- Rises were also evident in Adelaide, Perth, Darwin and Canberra.
- Over the eight months since the initial national restrictions were announced back in late March, prices for the hedonic “five capitals” index are down a relatively modest 1.6%.

There are now a range of indicators suggesting our property markets are only going perform strongly in 2021.
- Consumer confidence has been consistently improving as has business confidence
- Auction clearance rates have been consistently strong in the last quarter of 202, not just in the two big auction capital of Melbourne and Sydney but around Australia
- More buyers and sellers are in the market and transaction numbers have increased consistently.
- At the same time the banks are keen to write new business – another positive for our housing markets.
- Bank loan deferrals have been consistently falling – there’s little likelihood of an avalanche of forced mortgagee sales creating the fical cliff some commentators were worried about.
- Historically low interest rates and the “guarantee” of rates remaining low for at least 3 years, will give home buyers and investors confidence
- Strong jobs creation, rising consumer confidence and improving business confidence (leading to spending and employment) will underpin our housing markets.
Clearly, our housing markets were not immune to the Coronavirus economic fallout, but those house price predictions of significant falls did not eventuate and now all credible economists have forecast significant house price growth in 2021 and 2022
These graphics show how all our major capitals have median values higher than at the beginning of the year – we’ve passed the bottom of this cycle.

To help keep you up-to-date with all that’s happening in property, here is my updated weekly analysis of data and charts as of December 14th provided by Corelogic and realestate.com.au.
Early Market Indicators
Let’s start with the number of indicators that could give us a clue to what’s ahead.
- Despite the Christmas break looming, rental demand on realestate.com.au increased for the second consecutive week last week, as shown by realestate.com.au’s Weekly Demand Report.
The REA Insights Weekly Demand Index, fell by -4.6 per cent last week, which was its largest weekly fall since March 2020 in the midst of national lockdowns.

Cameron Kusher Executive Manager, Economic Research, reports that demand for houses fell by -4.9 per cent over week, while demand for units was -3.3 per cent lower.
“Each state recorded a fall in demand, with Queensland (-2.1%) and Victoria (-4.3%) seeing the smallest falls and New South Wales (-6.9%) and Australian Capital Territory (-6.6%) recording the largest.
Demand is now -20.6 per cent lower than its historic peak, however, it remains significantly higher than it was a year ago – up 44.9 per cent.
The largest year-on-year increases in demand have been recorded in Victoria (57.9%) and Northern Territory (48.4%), while the smallest increases have been recorded in Tasmania (13.3%) and Western Australia (27.1%).
Across all of the states, the year-on-year change is trending either flat or higher showing the overall strength of demand this year compared to last.
The year-on-year data clearly shows that buyer demand is strong despite the recent holiday season weakening and I fully expect that the high level of demand will continue into 2021.
Low borrowing costs, high levels of household savings and fiscal stimulus measures are likely to continue to drive strong demand for residential property, which we are already seeing feed into price and transaction volume increases.
The main challenge for buyers is likely to be the volume of stock available for sale.
With 2020 behind us, more vendors may be willing to test the market in 2021, particularly given how many buyers are currently ready to purchase. ” said Kusher.

2. Rental markets.
Realestate.com.au reported that sespite the Christmas break looming, rental demand on realestate.com.au increased for the second consecutive week last week.
The REA Insights Weekly Rental Demand Index, following a 1.5 per cent increase the week before last, there was a further 0.1 per cent rise in rental demand nationally last week.
Cameron Kusher Executive Manager, Economic Research explained that demand for rental houses was -0.2 per cent lower over the past week, though demand for rental units climbed by 0.3 per cent.
“Only New South Wales (-1.1%), South Australia (-1.5%) and Australian Capital Territory (-0.5%) recorded declines in rental demand last week, with Northern Territory (1.7%) and Queensland (1.5%) recording the largest increases.
Despite some recent increases, rental demand remains -24.2 per cent lower than its historic peak.
However, rental demand is up 23.3 per cent when compared to the same week last year.
Compared to last year, demand for rental houses is up 13.4 per cent, while demand for rental units has experienced a much larger increase, up 34.6 per cent.
Western Australia is the only state in which rental demand is lower than a year ago (-6.5%).
This is likely due to the fact that lending to first home buyers in Western Australia is at an historic high, more than doubling over the past 12 months.
Australian Capital Territory (38.4%) and Victoria (35.7%) have recorded the largest year-on-year increases in rental demand.
Rental demand typically rises early in January after falling through November and December, but things are playing out differently this year.
While the rises have been quite small to-date, it seems that some are getting a head start before the new year.
Early 2021 will be the litmus test for the rental market, with many leases expiring and no new foreign students arriving.
While demand is likely to be strong as people monitor the market conditions closely, what will be much more interesting is how much of an adjustment to rental prices occur as renters will undoubtedly be looking for cheaper rent or better rental accommodation.
It should be noted that we expect these adjustments to be much more prevalent in inner-city areas of major capital cities and for units as opposed to houses
It will definitely be something to closely monitor in early 2021″ said Kusher.
3. Newly advertised properties for sale
The following charts from Corelogic shows the change in the number of new residential listings being advertised for sale.
As we’re being closer to Christmas, the number of properties coming onto the market is slowly dropping.

What’s happening to property prices?
There has been a palpable change in property market sentiment over the last few months.
But there is a flight to quality.
The shortage of A-grade homes and investment properties compared to the number of buyers out looking for them mean that property values in certain locations are steadily creeping up.
On the other hand B grade (secondary) properties are selling at a discount and no one really wants C grade properties.
The following charts were updated on December 14th, 2020.


Properties listed for sale
At a time when as buyers are returning to the market as confidence rises, the overall number of properties listed for sale is down 13.7% over the last year.
This lack of good properties for sale at a time when many interested buyers have returned to the market is one of the reasons property prices have, in general, held up well.
This confirms what we are finding on the ground Metropole that well-located properties are selling quickly with a queue of buyers waiting for them.


The number of property transactions
The following table of private treaty sales (which represents the vast majority of all dwelling sales across the country shows that over the last week:
- In Melbourne, 2,125 houses (last week 2,092) and 992 apartments or units were sold (last week 948).
- In Sydney, 1,901 houses (1,904 last week) and 1,101 apartments were sold (1,104 last week), so the market is continuing its steady growth.
- In Brisbane, 1,222 houses (977 last week) and 298 apartments were sold (244 last week) – the market seems to be slowing down as Chritmas approaches.
NOW READ: Why Bluechip property will rebound strongly in 2021
Our Rental Markets
The COVID-19 pandemic has been an unprecedented shock to the rental housing market, reducing demand for rental properties at the same time as supply has increased.
Households most affected by the economic impact are more likely to be renters, and border closures have reduced international arrivals.
The number of vacant rental properties has increased as new dwellings have been completed and some landlords have offered short-term rentals on the long-term market, particularly in inner Sydney and Melbourne.
Government policies have supported renters and landlords.
Rents have declined, partly because of discounts on existing rental agreements and it is likely that rent growth in many areas will remain subdued for some time moving forward.
The absence of new and returning international students and the closing of international borders has dented rental property market, particularly in Sydney and Melbourne.
Vendor Metrics
Other than in Darwin, vendor metrics have suggested we’re moving into a seller’s market with the number of days to sell a property decreasing (a sign of the tight supply situation), and vendor discounting ( it’s easier for them to sell) at realistic levels.
The shortage of good properties on the market is seeing properties selling quickly with minimal discounting.

Auction clearance rates
Major capital city residential property market momentum has continued with a positive slant into year-end.
Prices across the five capital cities notched up some further gains this week as auction volumes continue to make up for lost ground during the height of the pandemic. 
In fact, rather than tailing off sharply as they normally do into the Christmas-New Year break, auction volumes rose this week in Sydney and Melbourne.
After holding steady at semi-recovered levels in recent weeks, Melbourne auction volumes increased 25.8% this week to 1,131, even though that’s still markedly down on 1,405 for the same week last year.
Auction clearance rates continued at around 70% give or take, at 73.6% according to the weekend preliminary report.
Last week’s rate was 67.7%, revised down later in the week from the initially-reported 73.5%.
Melbourne prices are so far up 0.3% this month, on track to record another month of gains as market activity and confidence continues to return.
At their measured low point in mid-October during the lockdown, prices were down as much as 6% on pre-pandemic levels and over 3% year to date then.
Prices will likely finish the year down a little less than 2%.
Sydney auction volumes also marched on, 1,006 scheduled, up from 867 the previous week and 14.9% above year-earlier levels.
Sydney’s auction clearance rate was 76.5%, a rate that won’t be too far from last week’s final 74.1% reading. 
Prices also rose in Sydney, up another 0.2% so far in December.
With only a fortnight to go (or less given minimal likely in the last week), prices have so far risen 2.2% for the year.
While Melbourne prices have been understandably volatile this year and Sydney saw prices cool off after mid-year, prices in Adelaide and Brisbane have been more resilient though did exhibit some signs of flattening in the September quarter.
Adelaide prices have risen 5¾% this year, Brisbane prices by 4¼%.
After a soft start, the Perth market increasingly found its feet as the year progressed, prices up a net 1¼%, all of that coming in the second half of the year.
It’s been a return to positive year-on-year returns for Perth house prices for the first time since the first half of 2015, when the market was under the weight of property over-supply as the post GFC inspired boom matured.
The Perth market has seen confidence return to the highest among the states according to the NAB Residential Property Survey, supported by strong business conditions in the resources sector and a property market that is now exhibiting all the signs of being under- rather than over-supplied.

Of course, the above auction clearance rates were on a relatively very small number of auctions.
Here are the long term auction clearance trends
Regional breakdown of auction results for last weekend:-


The Statistics above are updated weekly.
Now is the time to take action and set yourself for the opportunities that will present themselves as the market moves on
If you’re wondering what will happen to property in 2020–2021 you are not alone.
You can trust the team at Metropole to provide you with direction, guidance and results.
In challenging times like we are currently experiencing you need an advisor who takes a holistic approach to your wealth creation and that’s what you exactly what you get from the multi award winning team at Metropole.
Why not get the independent team of property strategists and buyers’ agents at Metropole to help level the playing field for you?
We help our clients grow, protect and pass on their wealth through a range of services including:
- Strategic property advice. – Allow us to build a Strategic Property Plan for you and your family. Planning is bringing the future into the present so you can do something about it now! Click here to learn more
- Buyer’s agency – As Australia’s most trusted buyers’ agents we’ve been involved in over $3Billion worth of transactions creating wealth for our clients and we can do the same for you. Our on the ground teams in Melbourne, Sydney and Brisbane bring you years of experience and perspective – that’s something money just can’t buy. We’ll help you find your next home or an investment grade property. Click here to learn how we can help you.
- Wealth Advisory – We can provide you with strategic tailored financial planning and wealth advice. Click here to learn more about we can help you.
- Property Management – Our stress free property management services help you maximise your property returns. Click here to find out why our clients enjoy a vacancy rate considerably below the market average, our tenants stay an average of 3 years and our properties lease 10 days faster than the market average.
Remember the multi award winning team of property investment strategists at Metropole have no properties to sell, so their advice is unbiased.
Whether you are a beginner or a seasoned property investor, we would love to help you formulate an investment strategy or do a review of your existing portfolio, and help you take your property investment to the next level.
Please click here to organise a time for a chat. Or call us on 1300 METROPOLE.
Source of graphs and data: CoreLogic.
The capital city residential property markets are finishing the year strongly.
Prices across our five capital cities notched up some further gains this week.
Similarly auction clearance rates ended the year solidly despite looming concerns about Covid 19 resurfacing.
These are all sign of the strength and depth of our property markets.
auction volumes rose this week in Sydney and Melbourne and auction results were strong around the country.
Melbourne property prices are up 0.3% so far this month, on track to record another month of gains as market activity and confidence continues to return.
At their measured low point in mid-October during the lockdown, prices were down as much as 6% on pre-pandemic levels and over 3% year to date then.
Melbourne’s median property value is likely finish the year down a little less than 2%.
Prices also rose in Sydney, up another 0.2% so far in December. With only a fortnight to go Sydney’s median property value has so far risen 2.2% for the year.
While Melbourne prices have been understandably volatile this year and Sydney saw prices cool off after mid-year, prices in Adelaide and Brisbane have been more resilient though did exhibit some signs of flattening in the September quarter. Adelaide prices have risen 5¾% this year, Brisbane prices by 4¼%.
After a soft start, the Perth market increasingly found its feet as the year progressed, prices up a net 1¼%, all of that coming in the second half of the year.
Buyers are back in droves around the country and currently Metropole’s buyers agent team are finding off-market deals are flourishing, particularly for sellers keen to finalise a deal before the traditional Christmas-New Year break.
This weekend Sydney and Melbourne’s weekend auction sales exceeded last year’s.
According to CoreLogic, the weekend’s preliminary national clearance rate was 73.6%, with Melbourne auction volumes up 25.8% this week, but that’s still down markedly on 1,405 for the same week last year.
This week’s heat map (see below) shows that over the week Australian property prices nudged a fraction higher.
Median prices are higher than they were 12 months ago in every city other than Melbourne (no surprise there) but there are still certain segments of the market that are going to suffer – the inner city apartment sales and rentals.
- Overall Sydney house prices rose 0.2% week and are up 3.3% over the last year
- Melbourne house prices rose 0.3% last weekend despite all the lockdowns will finish the year less than 2% down
- Brisbane house prices are up 0.2 last week, 0.8% over the last month, and 4.2% over the last year
- Rises were also evident in Adelaide, Perth, Darwin and Canberra.
- Over the eight months since the initial national restrictions were announced back in late March, prices for the hedonic “five capitals” index are down a relatively modest 1.6%.
There are now a range of indicators suggesting our property markets are only going perform strongly in 2021.
- Consumer confidence has been consistently improving as has business confidence
- Auction clearance rates have been consistently strong in the last quarter of 202, not just in the two big auction capital of Melbourne and Sydney but around Australia
- More buyers and sellers are in the market and transaction numbers have increased consistently.
- At the same time the banks are keen to write new business – another positive for our housing markets.
- Bank loan deferrals have been consistently falling – there’s little likelihood of an avalanche of forced mortgagee sales creating the fical cliff some commentators were worried about.
- Historically low interest rates and the “guarantee” of rates remaining low for at least 3 years, will give home buyers and investors confidence
- Strong jobs creation, rising consumer confidence and improving business confidence (leading to spending and employment) will underpin our housing markets.
Clearly, our housing markets were not immune to the Coronavirus economic fallout, but those house price predictions of significant falls did not eventuate and now all credible economists have forecast significant house price growth in 2021 and 2022
These graphics show how all our major capitals have median values higher than at the beginning of the year – we’ve passed the bottom of this cycle.
To help keep you up-to-date with all that’s happening in property, here is my updated weekly analysis of data and charts as of December 14th provided by Corelogic and realestate.com.au.
Early Market Indicators
Let’s start with the number of indicators that could give us a clue to what’s ahead.
- Despite the Christmas break looming, rental demand on realestate.com.au increased for the second consecutive week last week, as shown by realestate.com.au’s Weekly Demand Report.
The REA Insights Weekly Demand Index, fell by -4.6 per cent last week, which was its largest weekly fall since March 2020 in the midst of national lockdowns.
Cameron Kusher Executive Manager, Economic Research, reports that demand for houses fell by -4.9 per cent over week, while demand for units was -3.3 per cent lower.
“Each state recorded a fall in demand, with Queensland (-2.1%) and Victoria (-4.3%) seeing the smallest falls and New South Wales (-6.9%) and Australian Capital Territory (-6.6%) recording the largest.
Demand is now -20.6 per cent lower than its historic peak, however, it remains significantly higher than it was a year ago – up 44.9 per cent.
The largest year-on-year increases in demand have been recorded in Victoria (57.9%) and Northern Territory (48.4%), while the smallest increases have been recorded in Tasmania (13.3%) and Western Australia (27.1%).
Across all of the states, the year-on-year change is trending either flat or higher showing the overall strength of demand this year compared to last.
The year-on-year data clearly shows that buyer demand is strong despite the recent holiday season weakening and I fully expect that the high level of demand will continue into 2021.
Low borrowing costs, high levels of household savings and fiscal stimulus measures are likely to continue to drive strong demand for residential property, which we are already seeing feed into price and transaction volume increases.
The main challenge for buyers is likely to be the volume of stock available for sale.
With 2020 behind us, more vendors may be willing to test the market in 2021, particularly given how many buyers are currently ready to purchase. ” said Kusher.
2. Rental markets.
Realestate.com.au reported that sespite the Christmas break looming, rental demand on realestate.com.au increased for the second consecutive week last week.
The REA Insights Weekly Rental Demand Index, following a 1.5 per cent increase the week before last, there was a further 0.1 per cent rise in rental demand nationally last week.
Cameron Kusher Executive Manager, Economic Research explained that demand for rental houses was -0.2 per cent lower over the past week, though demand for rental units climbed by 0.3 per cent.
“Only New South Wales (-1.1%), South Australia (-1.5%) and Australian Capital Territory (-0.5%) recorded declines in rental demand last week, with Northern Territory (1.7%) and Queensland (1.5%) recording the largest increases.
Despite some recent increases, rental demand remains -24.2 per cent lower than its historic peak.
However, rental demand is up 23.3 per cent when compared to the same week last year.
Compared to last year, demand for rental houses is up 13.4 per cent, while demand for rental units has experienced a much larger increase, up 34.6 per cent.
Western Australia is the only state in which rental demand is lower than a year ago (-6.5%).
This is likely due to the fact that lending to first home buyers in Western Australia is at an historic high, more than doubling over the past 12 months.
Australian Capital Territory (38.4%) and Victoria (35.7%) have recorded the largest year-on-year increases in rental demand.
Rental demand typically rises early in January after falling through November and December, but things are playing out differently this year.
While the rises have been quite small to-date, it seems that some are getting a head start before the new year.
Early 2021 will be the litmus test for the rental market, with many leases expiring and no new foreign students arriving.
While demand is likely to be strong as people monitor the market conditions closely, what will be much more interesting is how much of an adjustment to rental prices occur as renters will undoubtedly be looking for cheaper rent or better rental accommodation.
It should be noted that we expect these adjustments to be much more prevalent in inner-city areas of major capital cities and for units as opposed to houses
It will definitely be something to closely monitor in early 2021″ said Kusher.
3. Newly advertised properties for sale
The following charts from Corelogic shows the change in the number of new residential listings being advertised for sale.
As we’re being closer to Christmas, the number of properties coming onto the market is slowly dropping.
What’s happening to property prices?
There has been a palpable change in property market sentiment over the last few months.
But there is a flight to quality.
The shortage of A-grade homes and investment properties compared to the number of buyers out looking for them mean that property values in certain locations are steadily creeping up.
On the other hand B grade (secondary) properties are selling at a discount and no one really wants C grade properties.
The following charts were updated on December 14th, 2020.
Properties listed for sale
At a time when as buyers are returning to the market as confidence rises, the overall number of properties listed for sale is down 13.7% over the last year.
This lack of good properties for sale at a time when many interested buyers have returned to the market is one of the reasons property prices have, in general, held up well.
This confirms what we are finding on the ground Metropole that well-located properties are selling quickly with a queue of buyers waiting for them.
The number of property transactions
The following table of private treaty sales (which represents the vast majority of all dwelling sales across the country shows that over the last week:
- In Melbourne, 2,125 houses (last week 2,092) and 992 apartments or units were sold (last week 948).
- In Sydney, 1,901 houses (1,904 last week) and 1,101 apartments were sold (1,104 last week), so the market is continuing its steady growth.
- In Brisbane, 1,222 houses (977 last week) and 298 apartments were sold (244 last week) – the market seems to be slowing down as Chritmas approaches.
NOW READ: Why Bluechip property will rebound strongly in 2021
Our Rental Markets
The COVID-19 pandemic has been an unprecedented shock to the rental housing market, reducing demand for rental properties at the same time as supply has increased.
Households most affected by the economic impact are more likely to be renters, and border closures have reduced international arrivals.
The number of vacant rental properties has increased as new dwellings have been completed and some landlords have offered short-term rentals on the long-term market, particularly in inner Sydney and Melbourne.
Government policies have supported renters and landlords.
Rents have declined, partly because of discounts on existing rental agreements and it is likely that rent growth in many areas will remain subdued for some time moving forward.
The absence of new and returning international students and the closing of international borders has dented rental property market, particularly in Sydney and Melbourne.
Vendor Metrics
Other than in Darwin, vendor metrics have suggested we’re moving into a seller’s market with the number of days to sell a property decreasing (a sign of the tight supply situation), and vendor discounting ( it’s easier for them to sell) at realistic levels.
The shortage of good properties on the market is seeing properties selling quickly with minimal discounting.
Auction clearance rates
Major capital city residential property market momentum has continued with a positive slant into year-end.
Prices across the five capital cities notched up some further gains this week as auction volumes continue to make up for lost ground during the height of the pandemic.
In fact, rather than tailing off sharply as they normally do into the Christmas-New Year break, auction volumes rose this week in Sydney and Melbourne.
After holding steady at semi-recovered levels in recent weeks, Melbourne auction volumes increased 25.8% this week to 1,131, even though that’s still markedly down on 1,405 for the same week last year.
Auction clearance rates continued at around 70% give or take, at 73.6% according to the weekend preliminary report.
Last week’s rate was 67.7%, revised down later in the week from the initially-reported 73.5%.
Melbourne prices are so far up 0.3% this month, on track to record another month of gains as market activity and confidence continues to return.
At their measured low point in mid-October during the lockdown, prices were down as much as 6% on pre-pandemic levels and over 3% year to date then.
Prices will likely finish the year down a little less than 2%.
Sydney auction volumes also marched on, 1,006 scheduled, up from 867 the previous week and 14.9% above year-earlier levels.
Sydney’s auction clearance rate was 76.5%, a rate that won’t be too far from last week’s final 74.1% reading.
Prices also rose in Sydney, up another 0.2% so far in December.
With only a fortnight to go (or less given minimal likely in the last week), prices have so far risen 2.2% for the year.
While Melbourne prices have been understandably volatile this year and Sydney saw prices cool off after mid-year, prices in Adelaide and Brisbane have been more resilient though did exhibit some signs of flattening in the September quarter.
Adelaide prices have risen 5¾% this year, Brisbane prices by 4¼%.
After a soft start, the Perth market increasingly found its feet as the year progressed, prices up a net 1¼%, all of that coming in the second half of the year.
It’s been a return to positive year-on-year returns for Perth house prices for the first time since the first half of 2015, when the market was under the weight of property over-supply as the post GFC inspired boom matured.
The Perth market has seen confidence return to the highest among the states according to the NAB Residential Property Survey, supported by strong business conditions in the resources sector and a property market that is now exhibiting all the signs of being under- rather than over-supplied.
Of course, the above auction clearance rates were on a relatively very small number of auctions.
Here are the long term auction clearance trends
Regional breakdown of auction results for last weekend:-
The Statistics above are updated weekly.
Now is the time to take action and set yourself for the opportunities that will present themselves as the market moves on
If you’re wondering what will happen to property in 2020–2021 you are not alone.
You can trust the team at Metropole to provide you with direction, guidance and results.
In challenging times like we are currently experiencing you need an advisor who takes a holistic approach to your wealth creation and that’s what you exactly what you get from the multi award winning team at Metropole.
Why not get the independent team of property strategists and buyers’ agents at Metropole to help level the playing field for you?
We help our clients grow, protect and pass on their wealth through a range of services including:
- Strategic property advice. – Allow us to build a Strategic Property Plan for you and your family. Planning is bringing the future into the present so you can do something about it now! Click here to learn more
- Buyer’s agency – As Australia’s most trusted buyers’ agents we’ve been involved in over $3Billion worth of transactions creating wealth for our clients and we can do the same for you. Our on the ground teams in Melbourne, Sydney and Brisbane bring you years of experience and perspective – that’s something money just can’t buy. We’ll help you find your next home or an investment grade property. Click here to learn how we can help you.
- Wealth Advisory – We can provide you with strategic tailored financial planning and wealth advice. Click here to learn more about we can help you.
- Property Management – Our stress free property management services help you maximise your property returns. Click here to find out why our clients enjoy a vacancy rate considerably below the market average, our tenants stay an average of 3 years and our properties lease 10 days faster than the market average.
Remember the multi award winning team of property investment strategists at Metropole have no properties to sell, so their advice is unbiased.
Whether you are a beginner or a seasoned property investor, we would love to help you formulate an investment strategy or do a review of your existing portfolio, and help you take your property investment to the next level.
Please click here to organise a time for a chat. Or call us on 1300 METROPOLE.
Source of graphs and data: CoreLogic.
from Property UpdateProperty Update https://propertyupdate.com.au/australian-property-market/
No comments:
Post a Comment