CoreLogic’s national home value index rose another 1.5% last month, taking Australia’s housing values 17.6% higher over the first nine months of the year and 20.3% higher over the past 12 months.
The annual growth rate is now tracking at the fastest pace since the year ending June 1989.
The monthly change in housing values remains positive across every capital city and broad rest of the state region, with Hobart and Canberra recording the largest growth, while Darwin and the recently revised Perth index recorded the softest growth conditions across the capitals.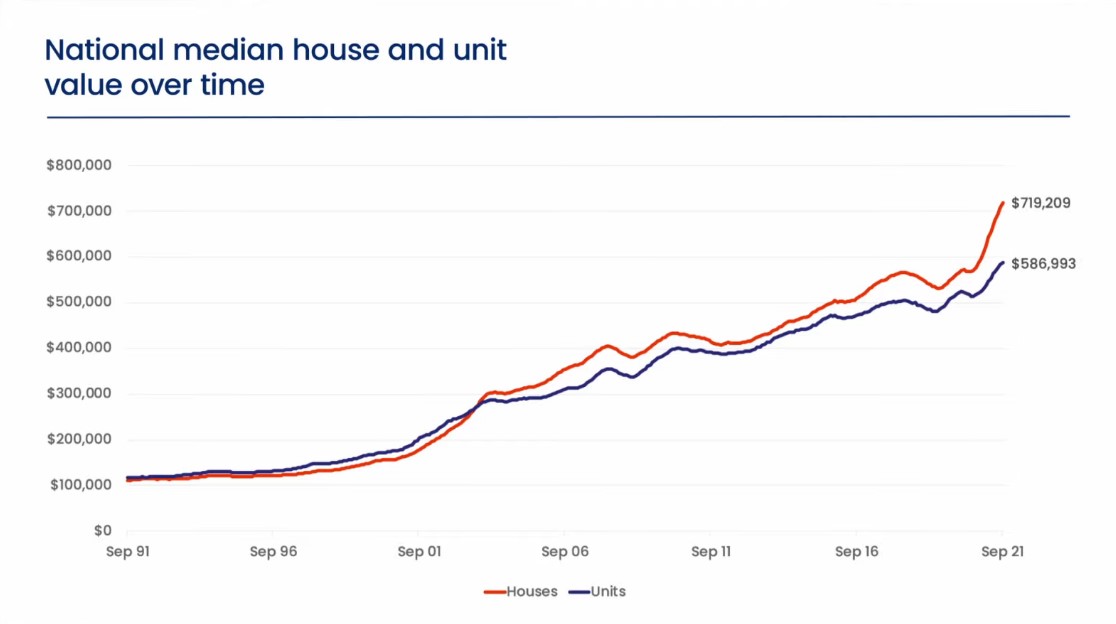
Across regional Australia, regional NSW, regional Tasmania, and regional Queensland led September’s capital gains.
Although growth conditions remain positive, it is becoming increasingly clear the housing market moved past its peak rate of growth in March when national dwelling values increased by 2.8%.
Since that time, the monthly rise in values has eased back to 1.5%.
The slowing momentum can be attributed to higher barriers for non-homeowners along with fewer government incentives to enter the market.
With housing values rising substantially faster than household incomes, raising a deposit has become more challenging for most cohorts of the market, especially first-home buyers.

Sydney is a prime example where the median house value is now just over $1.3 million.
In order to raise a 20% deposit, the typical Sydney house buyer would need to raise about $262,300.
Existing homeowners looking to upgrade, downsize or move home may be less impacted as they have had the benefit of equity that has accrued as housing values have surged.

The slowdown in first home buyer activity can be seen in lending data, where the number of owner-occupier first home buyer loans has fallen by -23% between January and August.
Over the same period, the number of first home buyers taking out an investment housing loan has increased, albeit from a low base, by 43%, suggesting more first home buyers are choosing to ‘rentvest’ as a way of getting their foot in the door.
Despite worsening affordability, house values are still generally rising faster than unit values; the trend that has been evident throughout most of the COVID period to date, especially across the capital cities.
Hobart and Darwin are the only capital cities where this trend has not occurred, with unit values rising 5.4 percentage points and 4.8 percentage points more than house values respectively over the past 12 months.

The reasons for this outperformance of the Hobart and Darwin unit markets look to be quite different.
In Hobart, demand is skewed towards a slightly older demographic that may be looking to downsize or looking for lower maintenance housing options against a backdrop of scarce unit supply.
In Darwin, the unit sector has moved through a long-running over-supply that has driven prices lower.

While the median value of a Darwin unit is the lowest of any capital city, unit rents have surged 20.3% higher over the past year, driving gross rental yields to 6.9%.
The stronger performance of house values relative to unit values is less obvious outside of the capital cities.
The differential between annual house and unit growth rates in the combined capital cities was 12.3 percentage points in the 12 months to September, compared to a 1.9 percentage point difference across regional Australia.

In fact, the September quarter saw unit values rising faster than house values across regional Australia.
This is probably the reflection of stronger demand for downsizing options and holiday homes in popular coastal markets.
Persistently low advertised supply remains a key factor placing upwards pressure on housing values across the country.

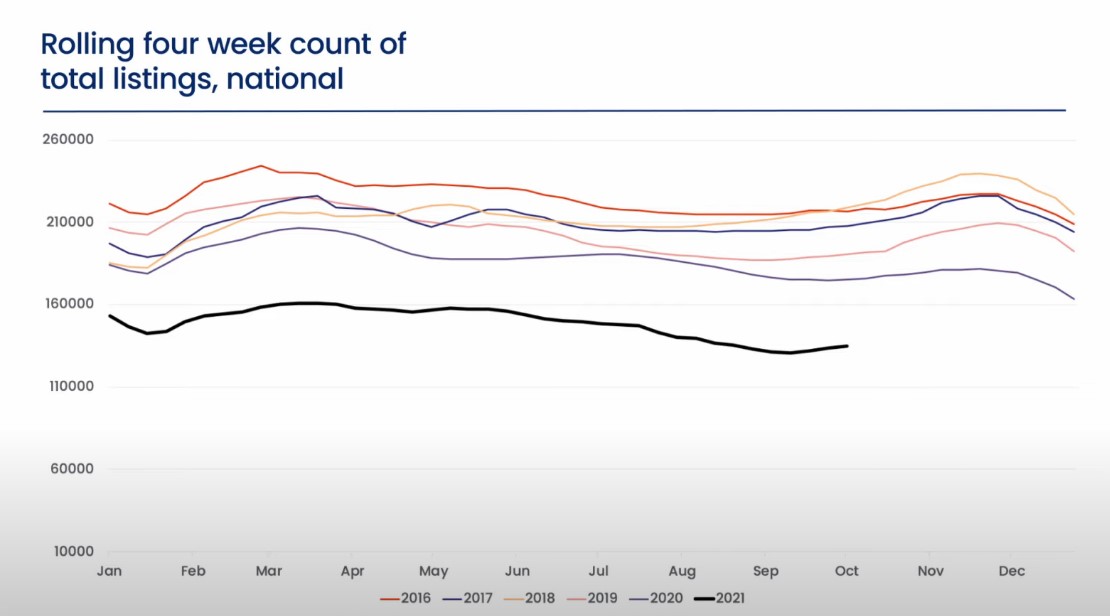
In a positive sign, the trend in new listings added to the marketplace is now rising, albeit from a low base.
Nationally, based on a rolling four-week count, the number of new listings is up 28% since the recent low point in early September, taking the trend in new listings 3% above the five-year average for this time of the year.
Although new listings are ramping up, the trend in total active listings remains extremely low, continuing to reflect the rapid rate of absorption seen amidst high buyer demand.

nationally, total advertised supply levels are -28.1% below the five-year average and every capital city is recording a below-average amount of advertised supply.
While inventory levels remain low, the number of home sales is well above average.
CoreLogic estimates the number of dwelling sales across Australia was 25.5% higher than the five-year average and 41.9% higher year-on-year at the end of September.
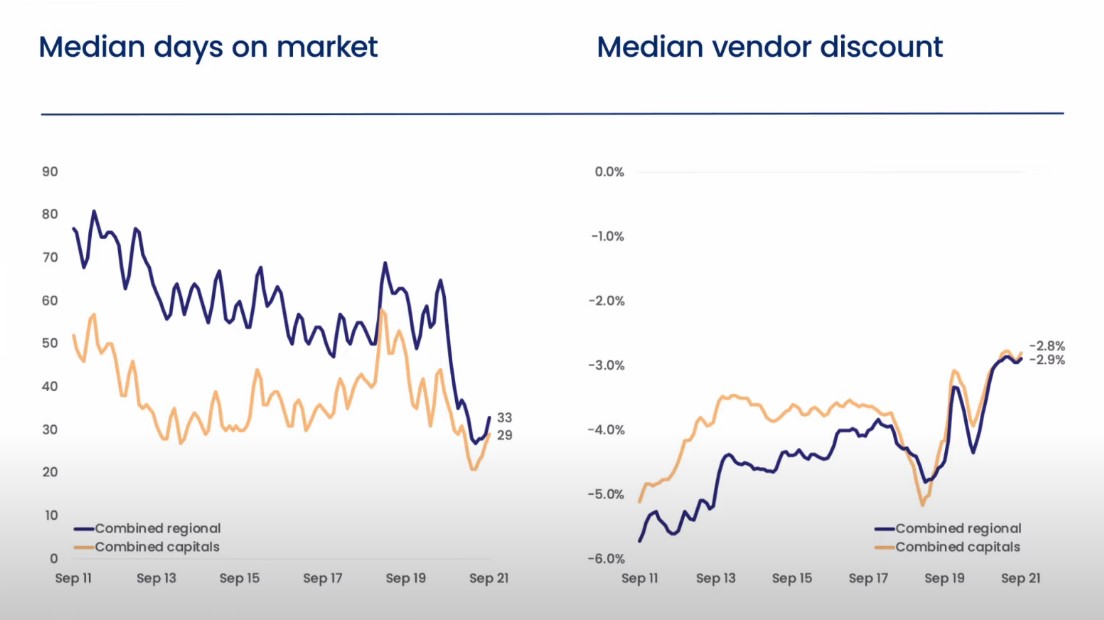
Such low levels of available supply along with high demand are keeping selling conditions skewed towards vendors.
Nationally, homes are selling in 35 days, up from 29 days in April, and vendor discounting levels remain around record lows at -2.8%.

Another factor pointing to strong selling conditions is the bounce back in auction clearance rates as restrictions relating to one-on-one property inspections were eased mid-month across Melbourne and Canberra.
By the end of September, the combined capitals clearance rate had returned to 80.5%, its highest level since late March.
ALSO READ: Australian housing values rising at the fastest annual pace since June 1989
from Property UpdateProperty Update https://propertyupdate.com.au/national-housing-market-update-australia/
No comments:
Post a Comment