Australia’s economic fortunes have improved according to the ANZ Bank’s most recent Stateometer -it’s quarterly assessment of the economic state of our States.
As housing construction keeps economies humming in the south east, resources construction in the west and north comes close to bottoming, and labour markets and trade improve nationwide, the ANZ Stateometer paints a picture of an economy moving closer to its trend rate in the June quarter. 
Today we look at their finding for the Victorian economy.
The good news is that the Victorian economy has been growing above trend for two years, and activity consolidated at a high level in the June quarter.
Housing, the labour market and trade were all positive contributors to the index in the quarter, although the contribution from housing has moderated since March.
The household sector improved over the past three months, and it is expanding at close to trend.
The business sector is a negative influence on the index.
Figure 1. Anz Stateometer Index

VICTORIA: IN HIGH DEMAND
Victoria has added a net 406,000 to its population over the past three years, contributing 40% of Australia’s population growth since the end of 2013, when the commodity construction boom began to unwind.
![[Imported] WP Advertize it Free Strategy ad 10 July 2014 (Desktop #44800)](https://propertyupdate.com.au/wp-content/uploads/2014/07/m-propertyinvestors-18July2014.png)
The labour market has absorbed that growth with a roughly steady unemployment rate.
The employment to population rate has improved slightly in trend terms over that period from 60.5% to 62.0%.
Annual employment growth of 3.8% last year has softened slightly to 3.1% in the year to July (trend) but remains solid.
Average hours worked has also started to recover.
Strong population growth has contributed to strength in household spending, which has been running at close to 3% (nominal) for the last two years.
Motor vehicles sales volumes are running at an annual pace of over 5% and annual house price growth has been mostly in the double digits since end 2013.
Businesses are reporting strong conditions, which are close to a 10-year high on the NAB survey.
Figure 2. Investment By Sector
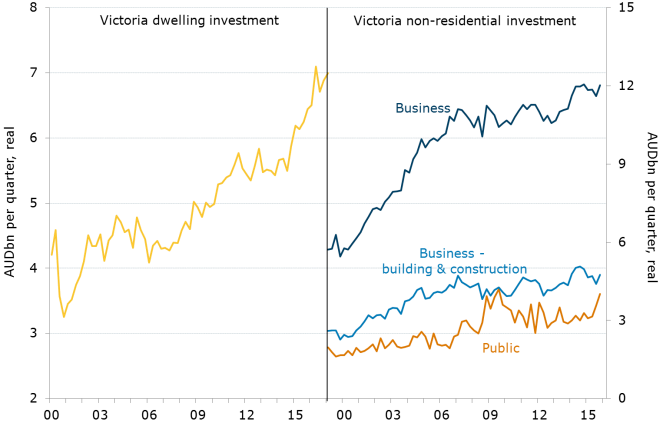
BUILD ‘EM UP
The demand for new housing in Victoria appears to have passed its peak, with approvals now 28% lower than in October 2015.
As in Sydney, this likely reflects some satiation of the market and softer demand due to efforts by the regulator and governments to make financial and buying conditions more restrictive for investors and foreigners. 
There remains 1½ years’ worth of work in the pipeline, which will continue to support dwelling investment at a high level (but without strong growth) for some time.
Public transport infrastructure has grown, aided by the Government’s solid finances and necessitated by the speed of population growth.
Major projects include the AUD 10.9bn Metro Tunnel and the AUD 5.5bn West Gate Tunnel.
Government infrastructure investment is planned to average AUD 9.6bn a year over the next four years, which is substantially above recent figures, although below NSW’s planned transport infrastructure spending.
Figure 3. Labour market indicators, Victoria

FOODIE TOURISM
Over the year to December 2016, international visitors to Victoria rose by more than 10%, which anecdotal accounts attribute to the states’ hospitality industry.
Another drawcard is its international education offering.
Victoria is one of the few states where services, and not commodities, are the main source of export earnings.
Figure 4. Population Growth Rates

from Property UpdateProperty Update https://propertyupdate.com.au/victoria-economy-2017/
No comments:
Post a Comment