FOMO (fear of missing out) remains the common theme around Australia’s property markets.
Auction clearance rates remain high, prices are continuing to rise and supply remains constrained.
With this past weekend a long weekend from the Labour Day public holiday in Victoria today, it was a much quieter weekend for auctions.
The preliminary auction clearance rate was a smidge over 80% but this will end up lower when all the results are reported.
Property prices have made further gains, another 0.4% so far in March after 2.1% last month and 2.9% year to date.
Sydney property prices rose 0.7% in the last week alone – up 3.6% in the last quarter and Sydney’s auction market remains strong clearing well over 80% of auctions for the fifth week in a row.
Melbourne property prices rose 0.5% last week, up 3.5% in the last quarter and weekend auction clearance rates remained strong over the long weekend.
Brisbane, Adelaide, and Perth prices all made strong gains over the last month.


The number of properties for sale in Australia is beginning to dry up.
At the time of increased demand, buyers are experiencing a lack of good properties available for sale which is driving FOMO (fear of missing out).
It will be interesting to see how potential sellers respond to the higher prices and if this increases the number of new property listings.
The charts below show how the number of new properties coming onto the market (listings) are slowing down.
Maybe sellers are holding back wondering if they can get more for their properties later on down the track, while other sellers are probably keen to buy first in this fast moving market and therefore holding back putting their properties up for sale.
Either way…strong demand at a time of limited supply must lead to property price growth.


To help keep you up-to-date with all that’s happening in property, here is my updated weekly analysis of data and charts as of March 8th provided by NAB, Corelogic, and realestate.com.au.
What’s happening in our property markets?
The REA Buyers Index
The REA Insights Buyer Demand declined by -1.5 per cent last week and it is failing to maintain momentum in any direction with index rises followed by falls over each of the past six weeks.

According to Cameron Kusher, Northern Territory and Australian Capital Territory were the only states or territories in which buyer demand increased over the past week.
Last week’s decline in demand also took the index -1.5 per cent below its peak nationally and the index is now lower than its historic peak across all states and territories.
While demand is failing to show a clear week-to-week trend currently, demand is substantially higher than it was a year ago, up by 41.1 per cent compared to the same time last year.
Demand is higher over the year across all states and territories however, the trend in the year-on-year change nationally is starting to decline.
Throughout the states, the year-on-year change in demand is trending higher in New South Wales, Queensland, South Australia, Tasmania and trending flat or lower in all other states.
Over the coming weeks we are going to be entering the period in which the nation was forced into lockdowns last year.
As a result we are likely to see the year-on-year change trending much higher as there was a substantial weakening of demand a year ago.
More broadly on the weekly trends we will likely continue to see some volatility week-to-week but I would expect that buyer demand will remain close to historic high levels.

The REA Rental Demand Index
The REA Insights Rental Demand Index nationally, rental demand fell by -2.2 per cent last week which was the third consecutive weekly decline.

According to Cameron Kusher, rental demand fell across each state and territory last week.
The level of rental demand last week was -12.9 per cent lower than its peak, however, it has increased by 19.3 per cent relative to the same time last year.
Year-on-year, rental demand has increased in all states, however, the magnitude of the rise varies greatly.
Nationally, the year-on-year trend in demand is fairly flat, while across the states demand is trending higher in Victoria and Western Australia and lower in New South Wales, Queensland, Tasmania and Northern Territory.
Over the next few weeks, we are entering the point at which national lockdowns occurred, which is likely to exacerbate the year-on-year changes in rental demand due to large falls in demand a year ago.
In terms of the weekly trends, we’re likely to see demand continue to trend lower over the coming weeks as we exit the busiest time of the year for the rental market during the first quarter.
But there is a flight to quality.
The shortage of A-grade homes and investment properties compared to the number of buyers out looking for them means that property values in certain locations are steadily creeping up.
On the other hand B grade (secondary) properties are selling at a discount and no one really wants C grade properties.

Properties listed for sale 
At a time when buyers are returning to the market as confidence rises, the overall number of properties listed for sale is down 16.9% over the last year.
This lack of good properties for sale at a time when many interested buyers have returned to the market is one of the reasons property prices have, in general, held up well.
This confirms what we are finding on the ground Metropole that well-located properties are selling quickly with a queue of buyers waiting for them.

Median property prices


NOW READ: Why Bluechip property will rebound strongly in 2021
Vendor Metrics
Vendor metrics suggest we’re into a seller’s market with the number of days to sell a property decreasing (a sign of the tight supply situation), and vendor discounting (it’s easier for them to sell) at realistic levels.
The shortage of good properties on the market is seeing properties selling quickly with minimal discounting.


Our Rental Markets
Corelogic report as follows….
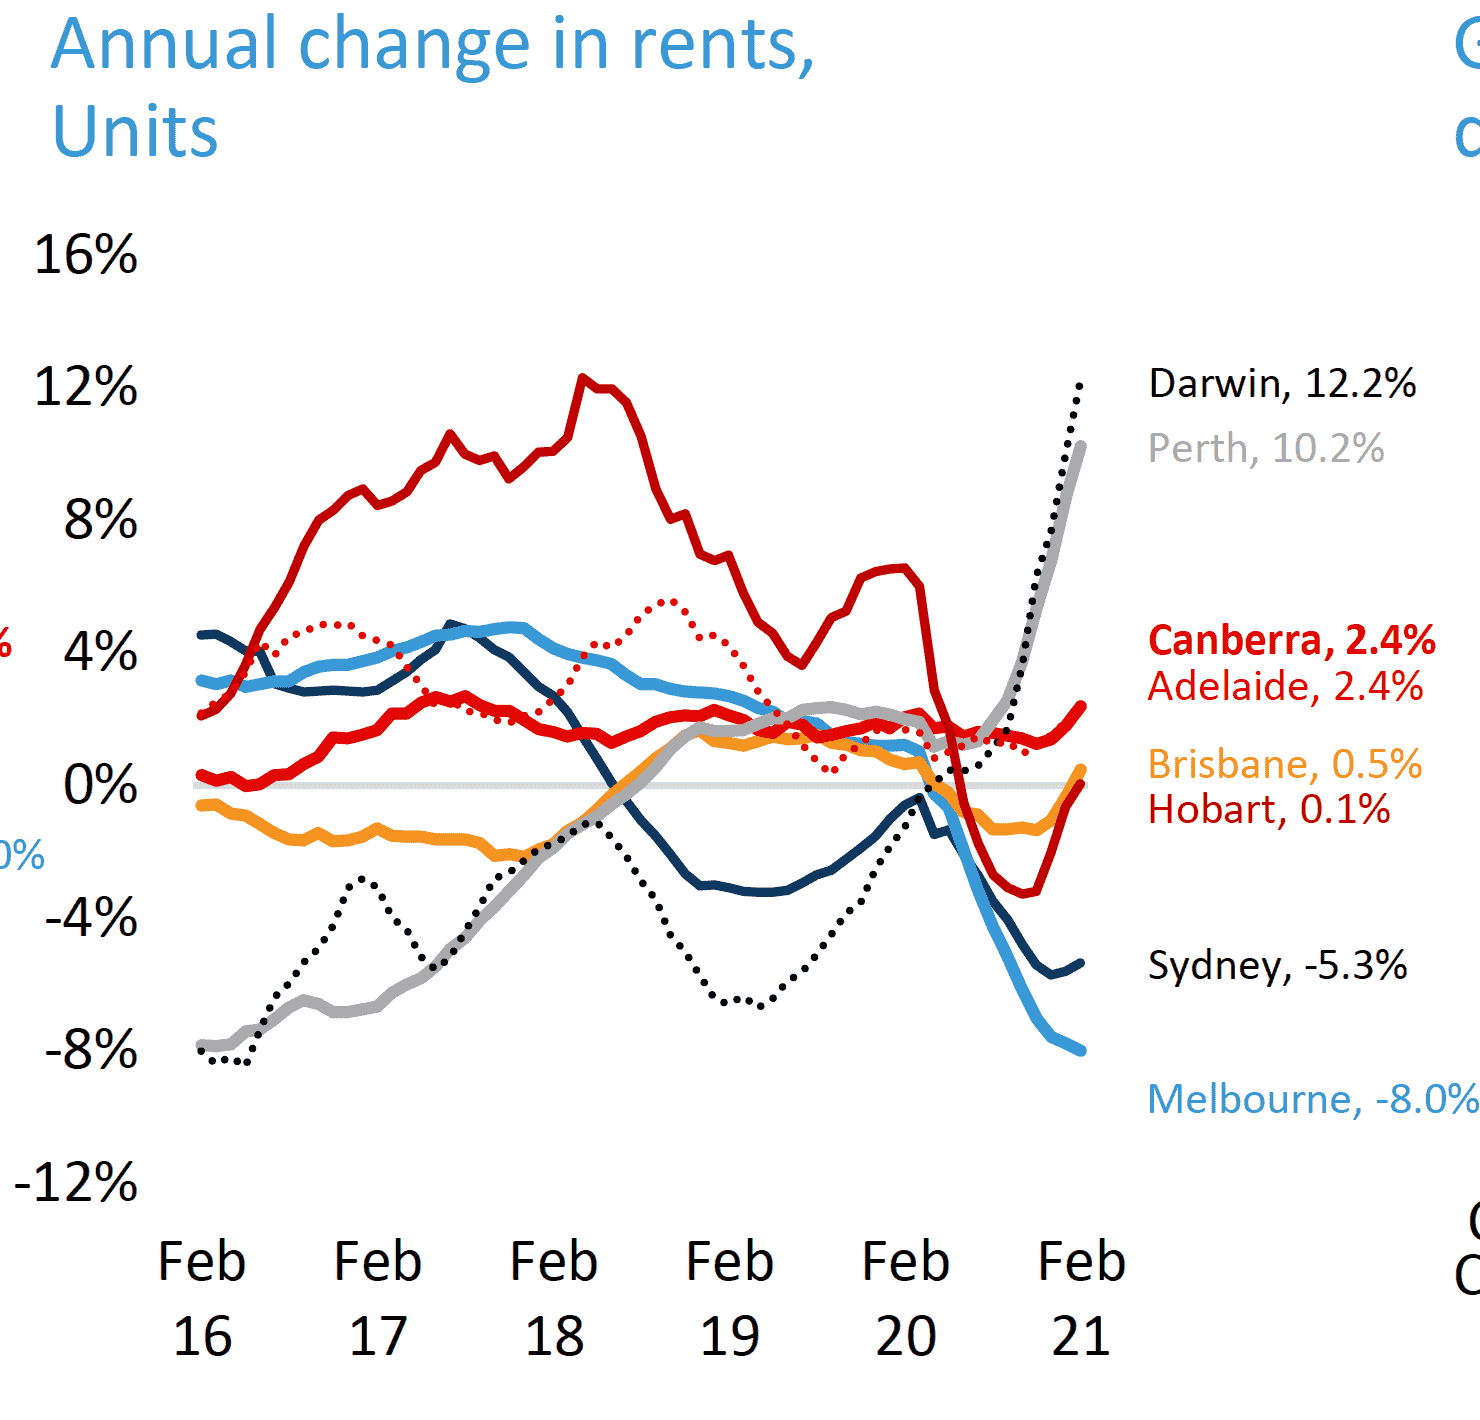
The disparity in rental markets across Australia has been extreme.
At one end of the spectrum we have extremely tight rental conditions in cities such as Perth and Darwin where both house and unit annual rental growth is above 10%.
At the other end are the unit rental markets of Sydney and Melbourne where rents have plunged over the last year, down -5.3% in Sydney, and -8.0% lower in Melbourne.
In a similar vein to housing values, rental markets are stronger within the detached housing sector relative to the unit sector.

Tim Lawless research director of Corelogic explains…
“The strength in Perth and Darwin’s rental sector can be attributed to a mix of low supply, due to a recent history of low investor participation, and rising demand as interstate migration trends move into positive territory.
The opposite trends in Sydney and Melbourne have seen rental markets weaken; higher rental supply due to a recent history of investor exuberance, weaker demand from negative interstate migration and, more recently, a demand shock from closed international borders where Melbourne and Sydney were the primary recipients of migrant arrivals.
However, the weak conditions across Sydney and Melbourne unit markets look to be turning.
Sydney’s rental index for units has recorded two successive months of mild rises, while Melbourne unit rents edged higher in February after falling for nine of the previous ten months.
The improvement in unit rents across Australia’s two largest cities is likely to be at least partially seasonal as demand from domestic students generally rises early in the year, but could also be attributable to more people returning to work in the inner cities as well as workers in some of the hardest hit industries such as hospitality, food and accommodation services returning to employment.
Until international borders re-open and migration rates return to their pre-COVID levels, a more substantial improvement in inner city apartment rents is unlikely.”
Weaker rental conditions in Sydney and Melbourne relative to rising home values is evident in the gross rental yields, with yields across both cities falling to fresh record lows in February.
Gross rental yields in Sydney were recorded at 2.9% at the end of February, while in Melbourne yields averaged 3.0%. Every other capital city is recording gross rental yields around the mid-4% mark or higher, implying positive cash flow opportunities are more likely in these markets.

Auction clearance rates
Corelogic report that there were 1,587 capital city homes taken to auction this week. Of the 1,311 results collected so far, 84.5% have reportedly sold.

This is an improvement on last week’s preliminary clearance rate of 81.9% when volumes were higher (2,473).
Final figures by Wednesday saw last week’s preliminary clearance rate revised down to 79.3%.
The lower volumes this week can be attributed to the four of the states and territories welcoming a public holiday on Monday, including Melbourne were volumes are down substantially over the week. There were 477 Melbourne homes auctioned this week, down on the 1,299 last week.
Of the results collected so far, 80.9% were sold results.
The final clearance rate last week came in at 76.4% and one year ago 66.1% of auctions cleared when volumes were a lower 418.
In Sydney, 812 homes were taken to auction this week, returning a preliminary auction clearance rate of 86.7%.
Last week, a higher 844 auctions were held with an 85.3% final clearance rate and one year ago 830 auctions took place and a 75.2% success rate was achieved.
According to preliminary figures, all of the smaller auction markets saw over 80% of auctions successful this week, Canberra returned the highest preliminary figure of 91.5%, followed by Brisbane (82.3%), Perth (81.8%) and Adelaide (81.7%)


Now is the time to take advantage of the opportunities that will present themselves as the market moves on in 2021

Sure the markets are moving on, but not all properties are going to increase in value. Now, more than ever, correct property selection will be critical.
You can trust the team at Metropole to provide you with direction, guidance and results.
In “interesting” times like we are currently experiencing you need an advisor who takes a holistic approach to your wealth creation and that’s what you exactly what you get from the multi award winning team at Metropole.
We help our clients grow, protect and pass on their wealth through a range of services including:
- Strategic property advice. – Allow us to build a Strategic Property Plan for you and your family. Planning is bringing the future into the present so you can do something about it now! Click here to learn more
- Buyer’s agency – As Australia’s most trusted buyers’ agents we’ve been involved in over $4Billion worth of transactions creating wealth for our clients and we can do the same for you. Our on the ground teams in Melbourne, Sydney and Brisbane bring you years of experience and perspective – that’s something money just can’t buy. We’ll help you find your next home or an investment grade property. Click here to learn how we can help you.
- Wealth Advisory – We can provide you with strategic tailored financial planning and wealth advice. Click here to learn more about we can help you.
- Property Management – Our stress free property management services help you maximise your property returns. Click here to find out why our clients enjoy a vacancy rate considerably below the market average, our tenants stay an average of 3 years and our properties lease 10 days faster than the market average.
Remember the multi award winning team of property investment strategists at Metropole have no properties to sell, so their advice is unbiased.
Whether you are a beginner or a seasoned property investor, we would love to help you formulate an investment strategy or do a review of your existing portfolio, and help you take your property investment to the next level.
Please click here to organise a time for a chat. Or call us on 1300 METROPOLE.
Source of graphs and data: CoreLogic.
from Property UpdateProperty Update https://propertyupdate.com.au/australian-property-market/
No comments:
Post a Comment